
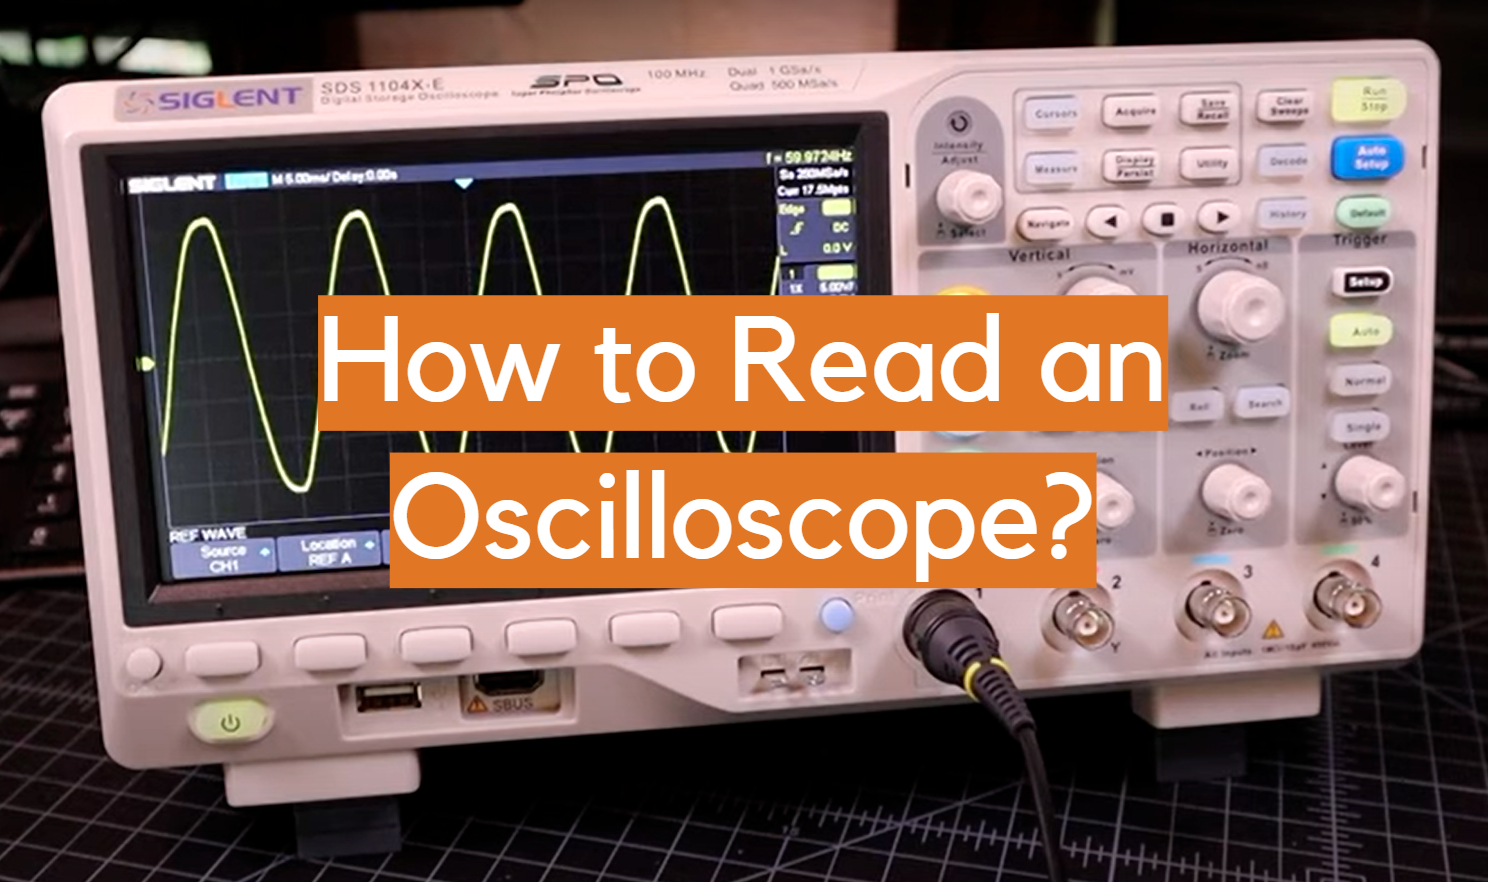
An oscilloscope is an essential piece of equipment for anyone working with electronics. It allows you to visualize the waveforms of electrical signals, making it easier to diagnose and troubleshoot problems. In this guide, we will answer some common questions about how to read an oscilloscope. We’ll provide some useful tips that will help you get the most out of your scope!
What is an Oscilloscope?
An oscilloscope is an electronic measurement instrument that allows you to visualize electrical signals. Oscilloscopes are used in a variety of applications such as engineering, electronics, and physics.
One of the most common types of oscilloscopes is the digital storage oscilloscope (DSO). DSOs use a digital memory to store signal data and allow for easy analysis on a computer.
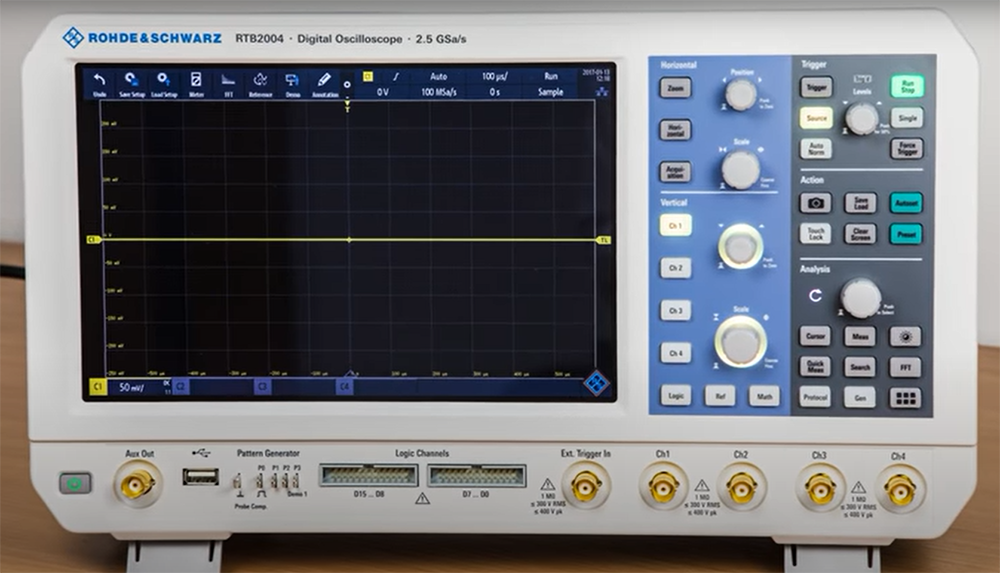
Display of Oscilloscope
An oscilloscope display typically consists of a graticule, which is a set of horizontal and vertical lines that delineate the area of the screen. The X-axis (horizontal) and Y-axis (vertical) are used to measure voltage with respect to time.
The X-axis is usually divided into units of time, such as seconds, milliseconds, or microseconds. The Y-axis is scaled in volts per division. For example, if the Y-axis is set to “20 V/div”, this means that each square on the grid equals 20 volts.
Z-axis is used to measure the intensity or brightness of the signal. The Z-axis is also known as the “sweep” axis, as it controls how fast the signal is displayed on the screen.
Now that we’ve covered some basics, let’s move on to how to actually use an oscilloscope!
Once the oscilloscope is triggered, the display will show a series of waveforms. These waveforms can be used to troubleshoot electrical circuits or to analyze the behavior of electronic devices.
Oscilloscopes can be used to measure a variety of electrical signals, including AC and DC signals, square waves, and pulses. Oscilloscopes are also useful for measuring frequency, period, and duty cycle.
To understand how to read an oscilloscope, it is important to first understand some basic concepts about electricity and waves. [1]
Electrical Signals
An electrical signal is a time-varying voltage that carries information through wires or other conductors. The three most common types of electrical signals are direct current (DC), alternating current (AC), and pulse-width modulated (PWM) signals.
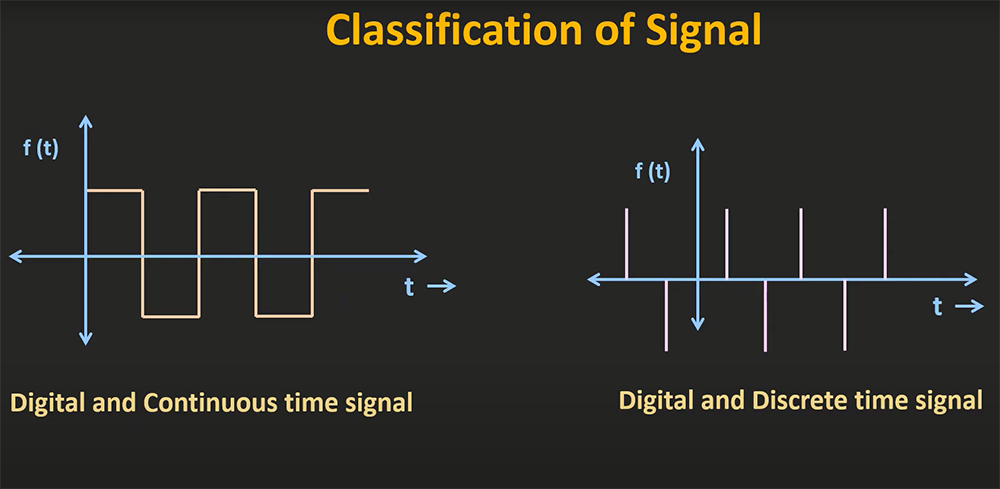
DC signals are constant, meaning the voltage does not change over time. AC signals alternately positive and negative voltages with respect to a reference voltage, typically zero volts. The waveform of an AC signal looks like a sine wave. PWM signals are digital signals that vary between two logic levels, such as 0 V and +12 V. The duty cycle of a PWM signal is the percentage of time that the signal is high (logic level “on”) compared to the total period of the signal.
Waves
A wave is a repeating disturbance that transfers energy through matter or space. There are two main types of waves: mechanical waves and electromagnetic waves.
Mechanical waves, such as sound waves, require a medium to travel through (such as air or water). Electromagnetic waves, such as light waves, do not require a medium and can travel through a vacuum.
Waveforms and Their Measurements
Oscilloscopes display waveforms on a screen that represent the voltage of an electrical signal over time. All waves have amplitude, wavelength, time and frequency.
Amplitude
The most basic measurement you can make with an oscilloscope is amplitude, or peak-to-peak voltage. Amplitude is an important parameter to measure because it represents the strength of an electrical signal. A higher amplitude indicates a stronger signal, while a lower amplitude indicates a weaker signal. To measure amplitude, simply find the difference between the highest and lowest points of the waveform on the screen.
Time
Period is the time it takes for one complete cycle of a waveform to occur. To measure period, simply find the point where the waveform repeats on the screen and divide by the number of cycles that have occurred.
Rise time is the amount of time it takes for a signal to go from low to high (or vice versa). To measure rise time, find the points on the screen where the signal transitions from low to high (or vice versa) and divide by the amount of time that has elapsed.
There are other types of time measurements as well, but these are the most common.
Wavelength
The wavelength is the distance between two identical points on the wave (such as two peaks or two troughs). The wavelength can be measured in units of length, such as meters or feet.
Frequency
Frequency is another important measurement that you can make with an oscilloscope. Frequency is a measure of how often a waveform repeats itself over time. The unit of frequency is the hertz (Hz), which represents one cycle per second.
Frequency can be measured in two ways: period and duty cycle. Period is simply the inverse of frequency and is measured in seconds (s). Duty cycle is the percentage of time that a signal is ON compared to the total period of the signal.
Duty cycle
The duty cycle of a waveform is the percentage of time that wave is either positive or negative. A duty cycle can be expressed as a ratio or as a percentage.
The duty cycle of a square wave is 50%. This means that for every second that passes, the wave will spend half its time positive and half its time negative. Duty cycles are important because they tell you how much power is being transmitted by a signal. A high duty cycle means more power is being transmitted than a low duty cycle.
Minimum and maximum voltage
The minimum and maximum voltage (or swing) of a signal is the difference between the highest and lowest points of the signal. The minimum voltage is the point where the waveform transitions from high to low, while the maximum voltage is the point where the waveform transitions from low to high.[2]
Oscilloscope Basics
Now that you understand some basic concepts about electrical signals and waves, let’s take a look at how to read an oscilloscope.
The two main parts of an oscilloscope are the horizontal controls and the vertical controls. The horizontal controls determine the position of the trace on the screen, as well as the time scale. The vertical controls determine the amplitude of the trace on the screen.
In order to measure a signal with an oscilloscope, you must connect the probe to the signal via a BNC cable. The tip of the probe is connected to one end of the signal, while the ground clip is connected to either another point on the same end of the signal or to a ground connection (such as earth ground or chassis ground).
Once you have connected your probe, you can turn on your oscilloscope and adjust the horizontal and vertical controls to position the trace on the screen. To measure a signal, you will need to set the oscilloscope to the correct time scale and voltage scale.
The time scale is determined by the period of the signal being measured. The voltage scale is determined by the amplitude of the signal being measured.
Once you have adjusted the horizontal and vertical controls, you can take measurements of your signal. As we already covered, the most common measurements are amplitude, period, and duty cycle. To measure the amplitude of a signal, you can use the cursors on your oscilloscope. These allow you to precisely position two lines on the screen and measure the distance between them. [1], [2]
Various Waveform Shapes
There are many different types of waveforms that you may encounter when using an oscilloscope. Each waveform has its own characteristics that can tell you a lot about the signal that you are measuring. In this section, we will take a look at some of the most common waveforms and what they can tell you.
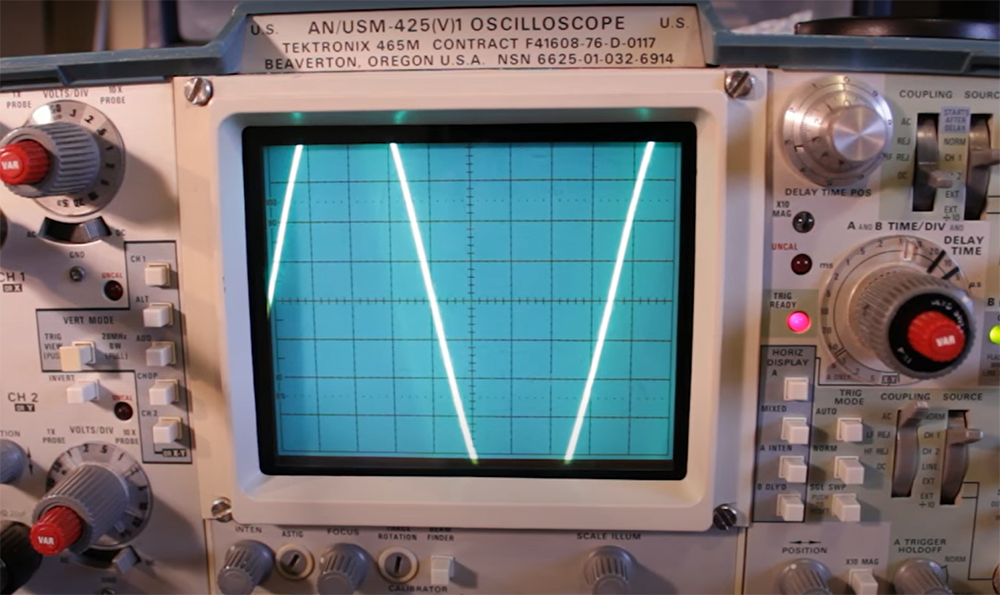
Rise and fall waveforms
The most basic waveform that you will encounter is the rise and fall waveform. This waveform is simply a repeating pattern of a rising edge followed by a falling edge. The time between the rising and falling edges is known as the period.
The rise and fall waveform can be used to measure many different things, such as frequency, duty cycle, and amplitude. The shape of the waveform can also give you information about the signal that you are measuring. For example, a symmetrical rise and fall waveform indicates that the signal is evenly balanced between positive and negative values. An asymmetrical waveform indicates that the signal is biased towards either positive or negative values.
To read a rise and fall waveform, simply look at the time between the rising and falling edges. The period is the time it takes for the waveform to repeat itself. The frequency is simply the inverse of the period.
Momentary changed waveforms
One of the most common waveforms that you will encounter is the momentary change waveform. This type of waveform occurs when there is a sudden change in the signal, usually caused by an external influence, such as when a switch is turned on or off. Momentary change waveforms can be either positive or negative, depending on the direction of the change.
The width of the pulse (the time between the rising and falling edges) can tell you how long the change lasted. The amplitude of the pulse can tell you how much.
Random noise waveform
Another type of waveform that you will see when using an oscilloscope is a random noise waveform. This type of waveform is characterized by its chaotic and unpredictable nature. Random noise can be caused by a variety of factors, such as electrical interference, thermal noise, or even cosmic rays. While this type of waveform can be very difficult to interpret, it can still provide some valuable information about the signal that you are measuring.
Random noise waveforms can tell you a lot about the quality of your signal. If you are seeing a lot of random noise in your signal, it may be indicative of a problem with your equipment or measurement setup. In addition, random noise can also be used to determine the bandwidth of your signal. The higher the bandwidth of your signal, the more random noise you will see.
When troubleshooting a problem with your equipment, it can be helpful to take a look at the random noise in your signal. If you are seeing a lot of random noise, it may be indicative of a problem with your equipment or measurement setup. In addition, random noise can also be used to determine the bandwidth of your signal. The higher the bandwidth of your signal, the more random noise you will see. [3]
FAQ
How do you read an oscilloscope value?
To read an oscilloscope value, you need to understand the three main types of measurements: amplitude, time, and voltage. These are the three key characteristics that will be represented on any oscilloscope reading.
When you take a measurement with an oscilloscope, you will see a trace on the screen that represents the voltage over time. The X-axis will represent time, and the Y-axis will represent voltage.
How do you read an oscilloscope waveform?
The first step is to identify the different parts of the waveform. The vertical axis represents voltage, while the horizontal axis represents time. The amplitude of the waveform is represented by the height of the peaks, and the period is represented by the distance between successive peaks. The wavelength is represented by the distance between any two points on a wave with identical values.
Once you have identified these different parts of the waveform, you can begin to interpret what they mean. Generally speaking, higher amplitude waves will be louder, and shorter wavelength waves will have higher frequencies.
What does an oscilloscope tell you?
An oscilloscope can tell you many things about a signal, including its amplitude, frequency, and rise time. By looking at the shape of the waveform on the screen, you can also determine if it is distorted in any way.
Oscilloscopes are commonly used to debug electronic circuits and measure voltage levels. They are also used in communications systems to monitor digital signals for errors.
Useful Video: How to Read an Oscilloscope – GCSE and A Level Physics
Conclusion
Oscilloscopes are a vital piece of equipment for anyone working with electronics. By understanding the basic concepts of how they work and what they can measure, you can unlock their full potential. With a little practice, reading an oscilloscope will become second nature. In this article we have covered the different axis, how to read voltage, time, and frequency, as well as some other useful tips. We hope that this guide has been helpful in getting you started with using oscilloscopes. And as always, if you have any questions or feedback, feel free to reach out to us at. We’re happy to help.Happy measuring!
References:
- https://www.tek.com/en/documents/primer/oscilloscope-basics
- https://learn.sparkfun.com/tutorials/how-to-use-an-oscilloscope/all
- https://www.fluke.com/en-us/learn/blog/oscilloscopes/how-to-read-a-waveform-on-an-oscilloscope